Weather Station
Carrboro, North Carolina
CHECKING STATUS
Current temperature
--.- °C
--.- °F
Watching for the next wildlife visitor…
Click any image to view it at full size.
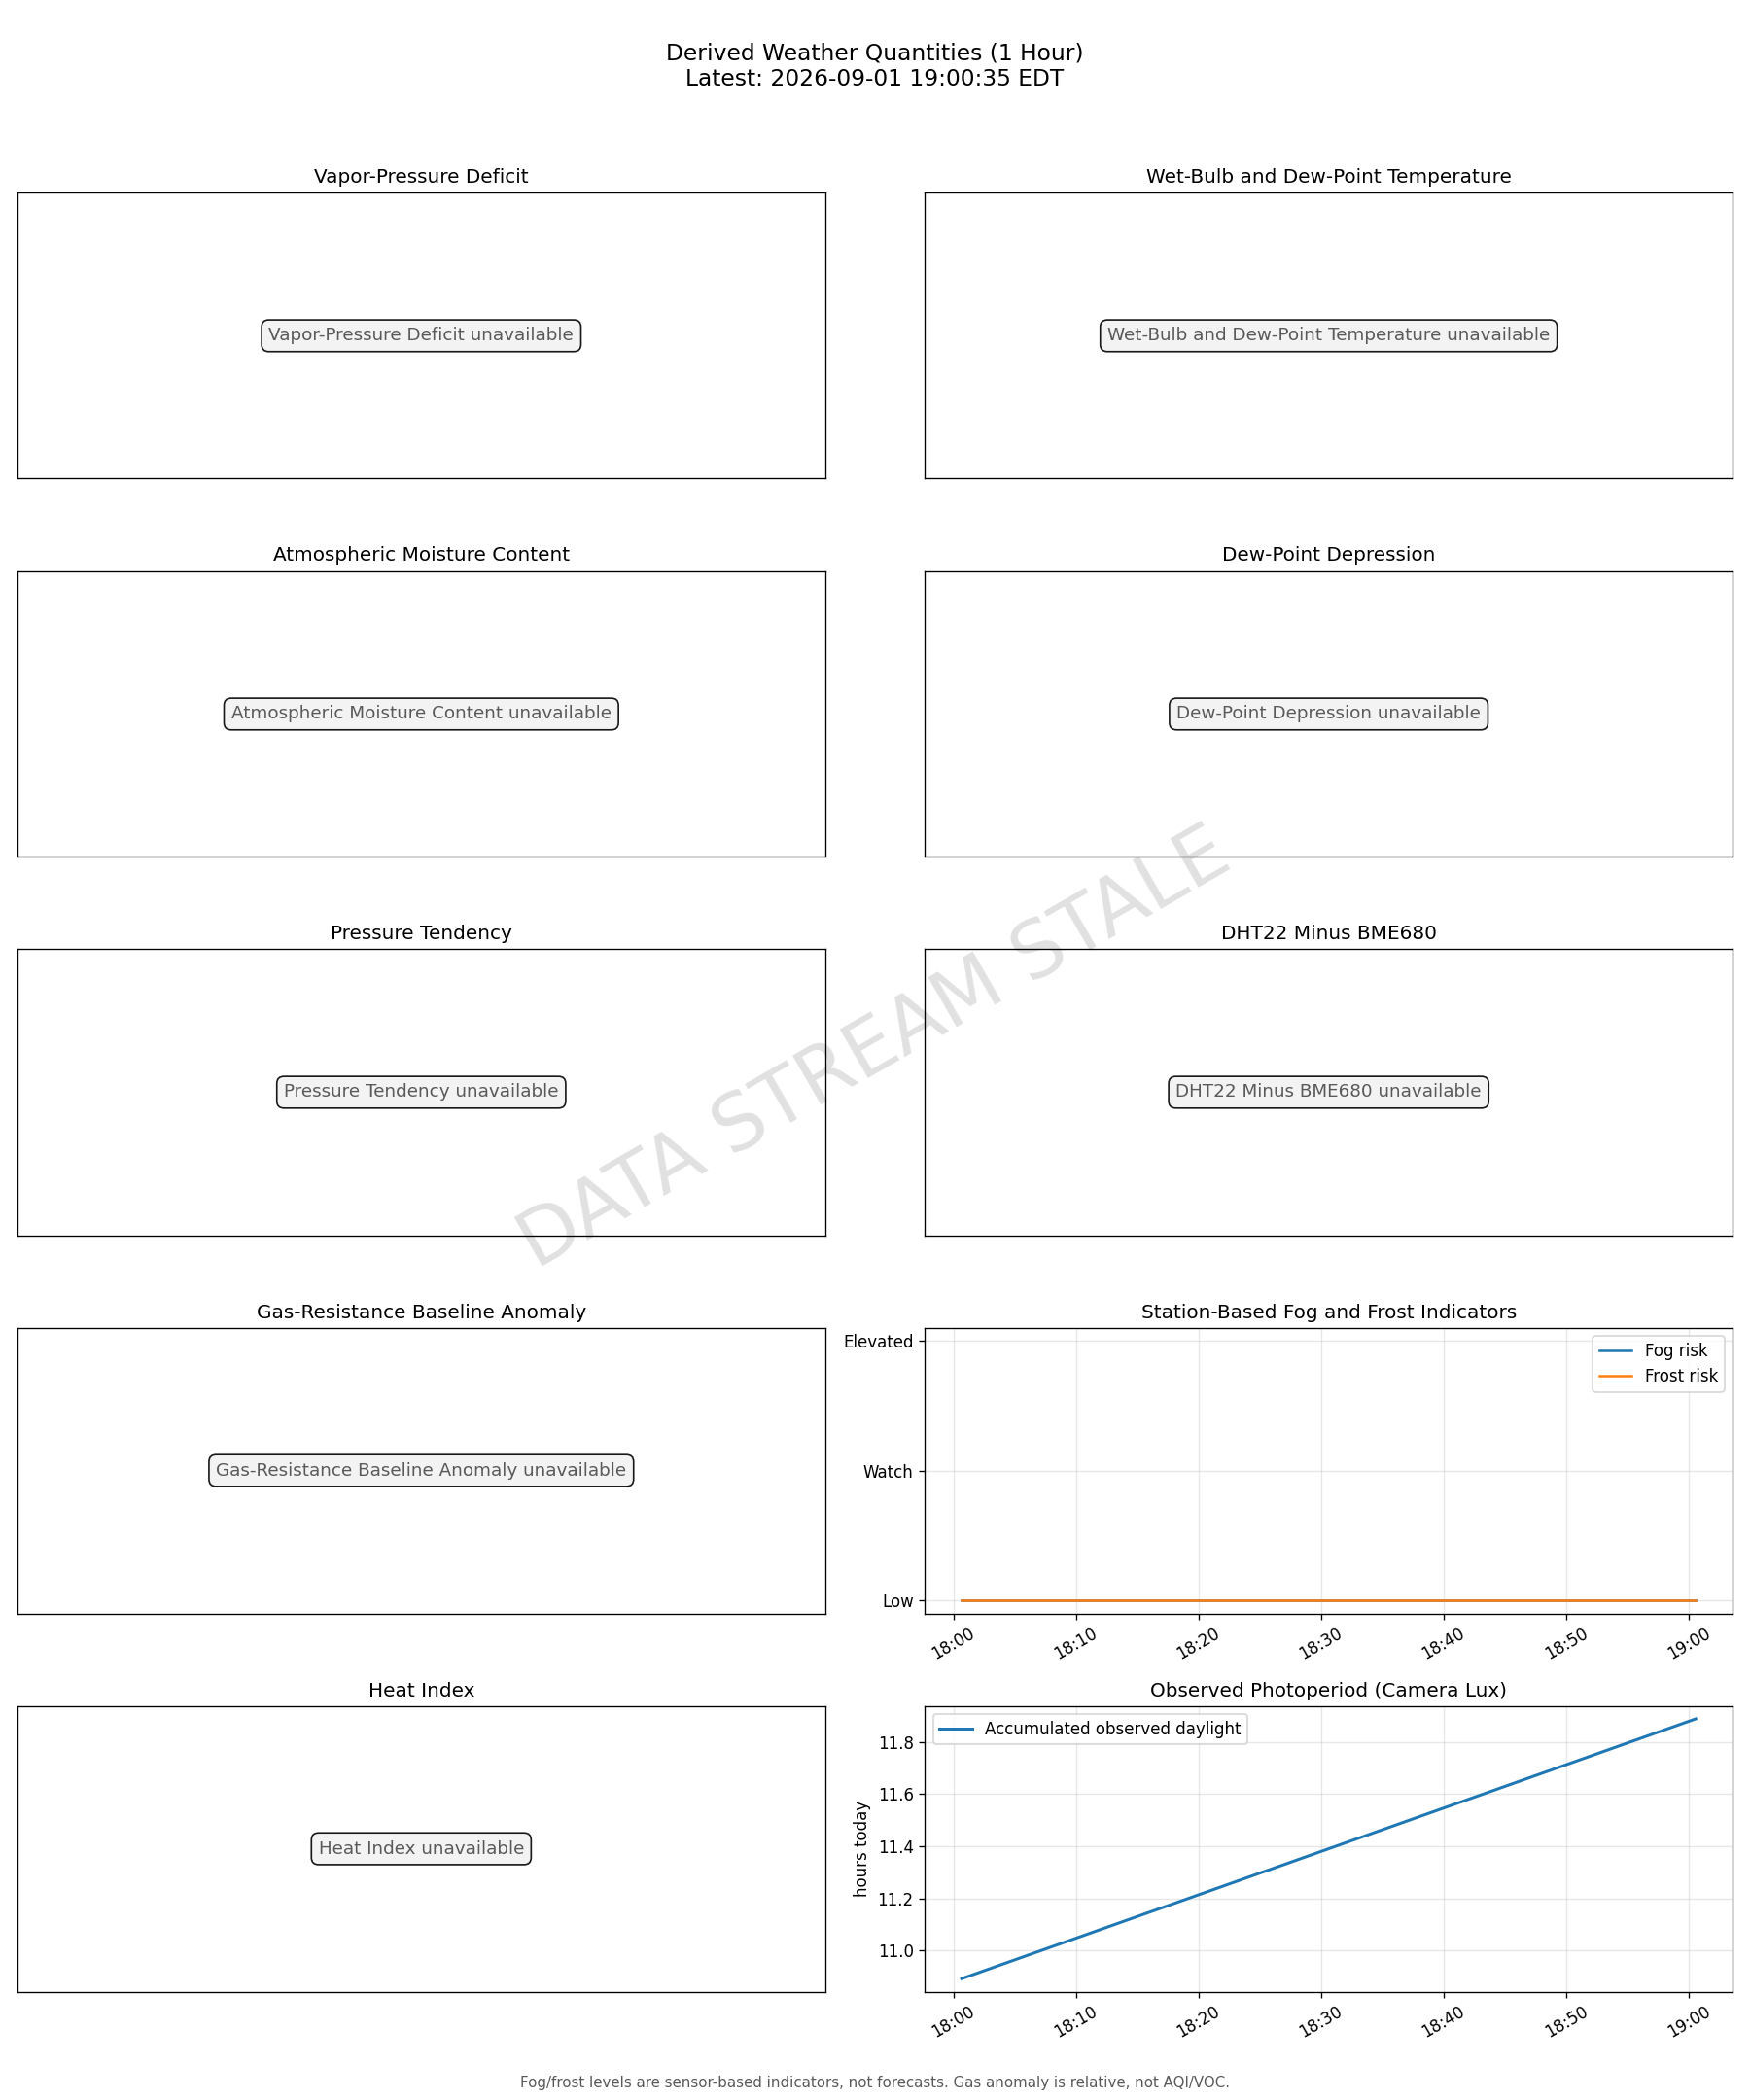
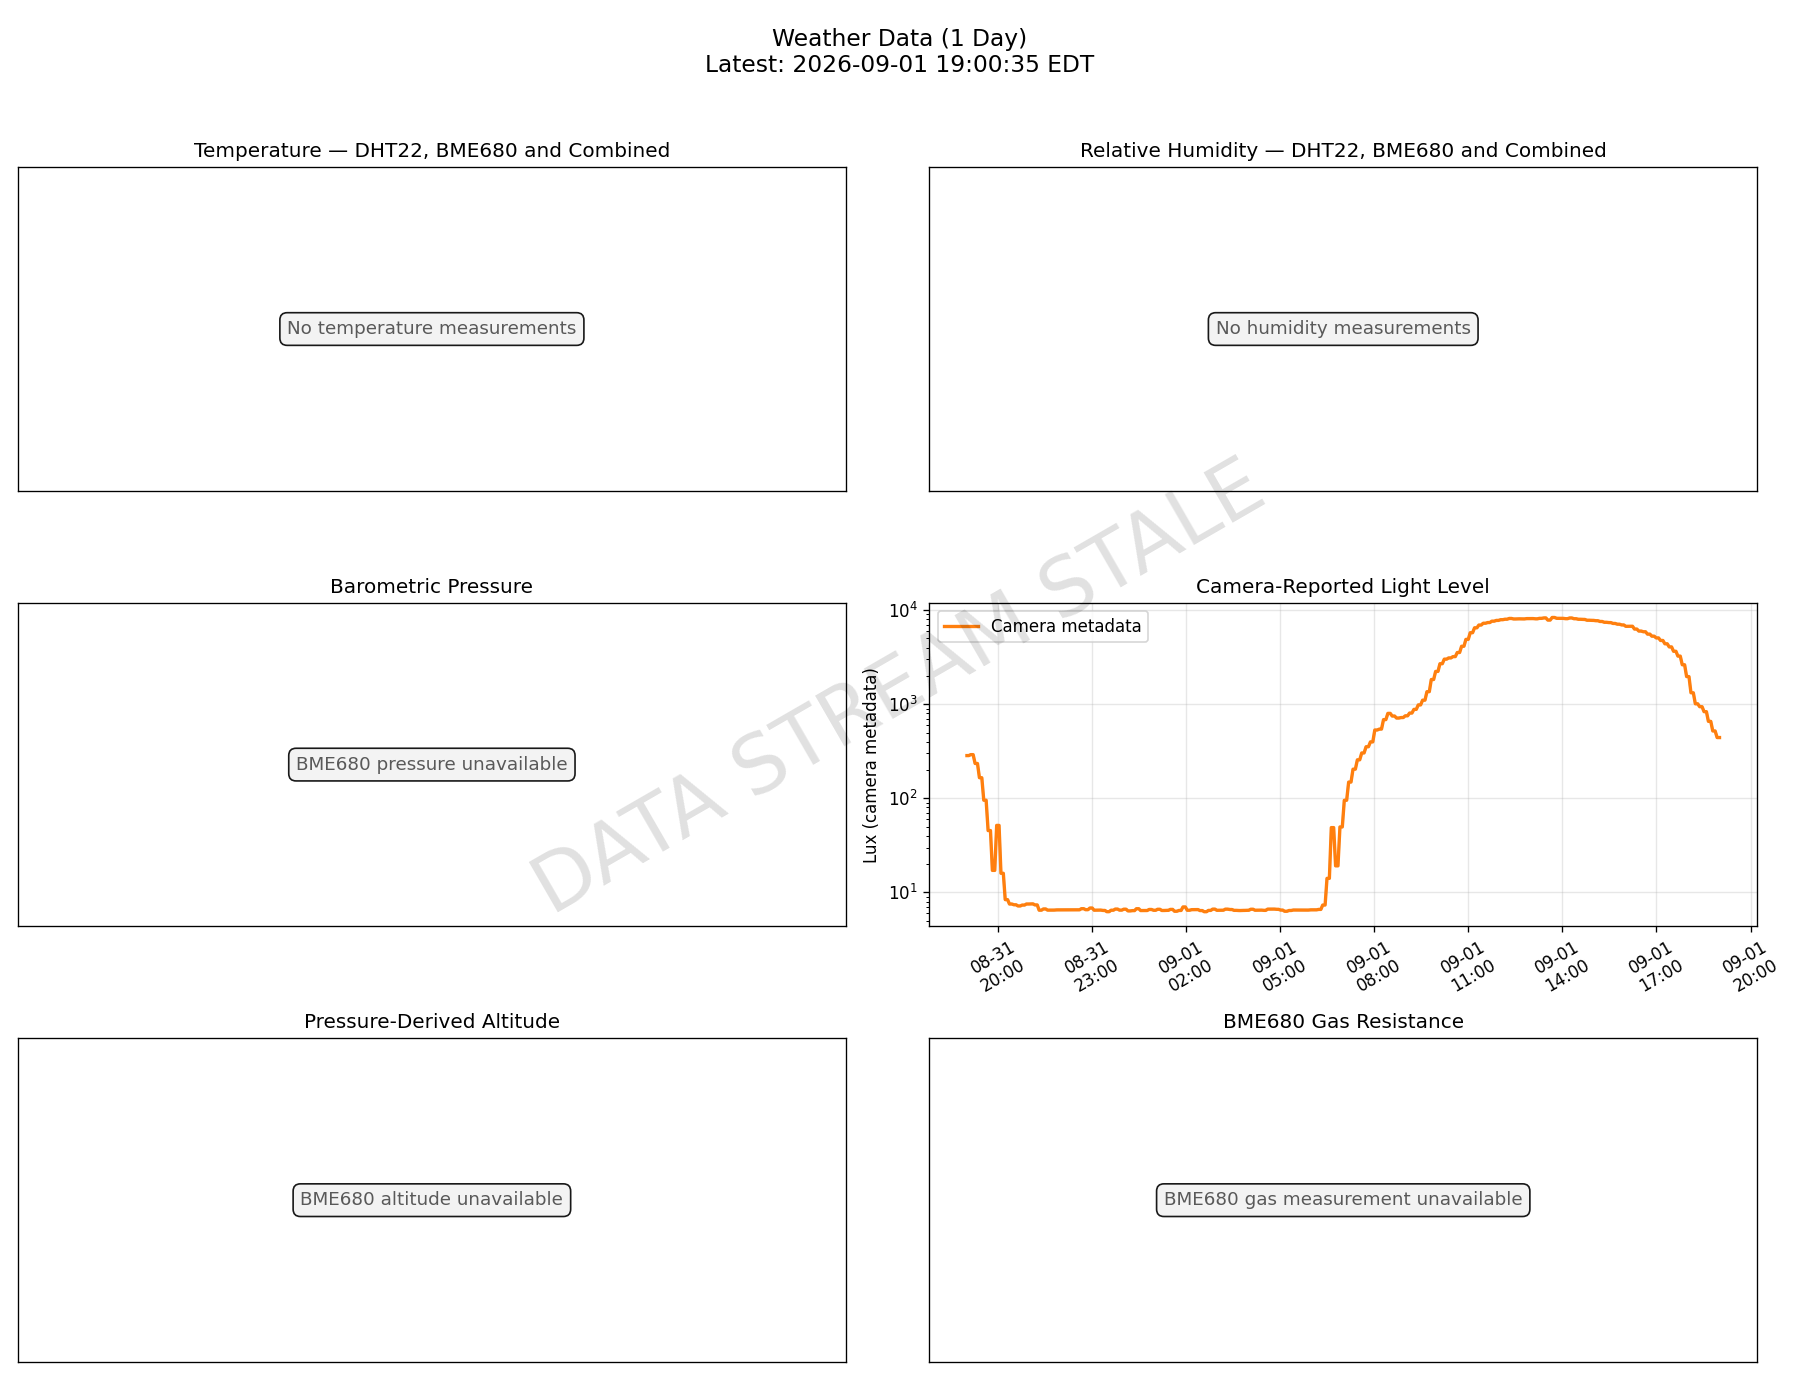

Temperature, relative humidity, and pressure measured together over the last 30 days. Color runs from older to newer readings; the red star is the latest.
This is a view of covariance in the local weather, not an ideal-gas-law fit. PV = nRT reduces to P ∝ T only when the amount and volume of gas are fixed; the open atmosphere satisfies neither condition.
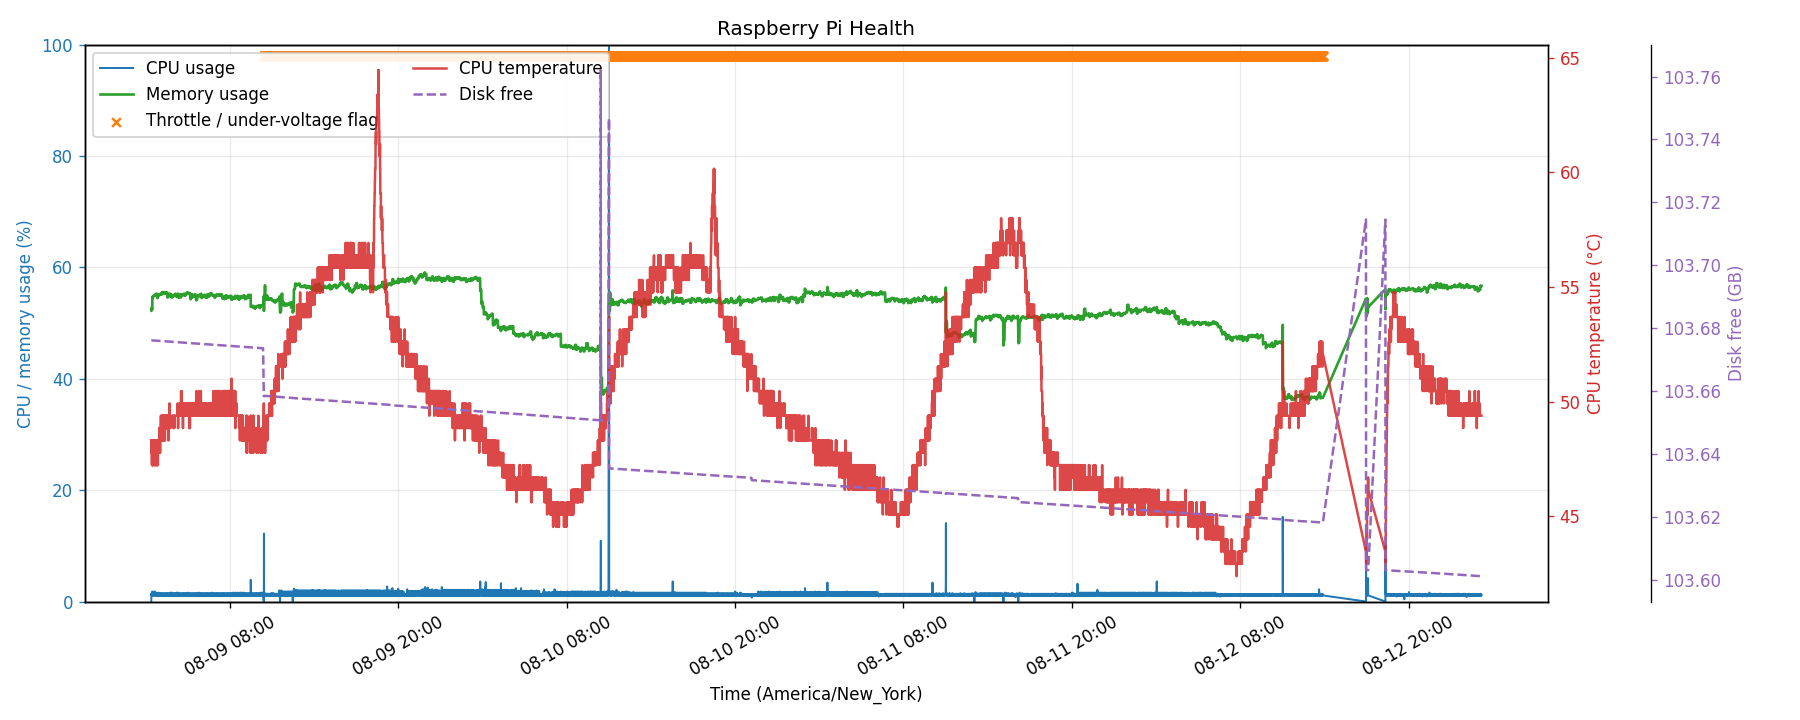
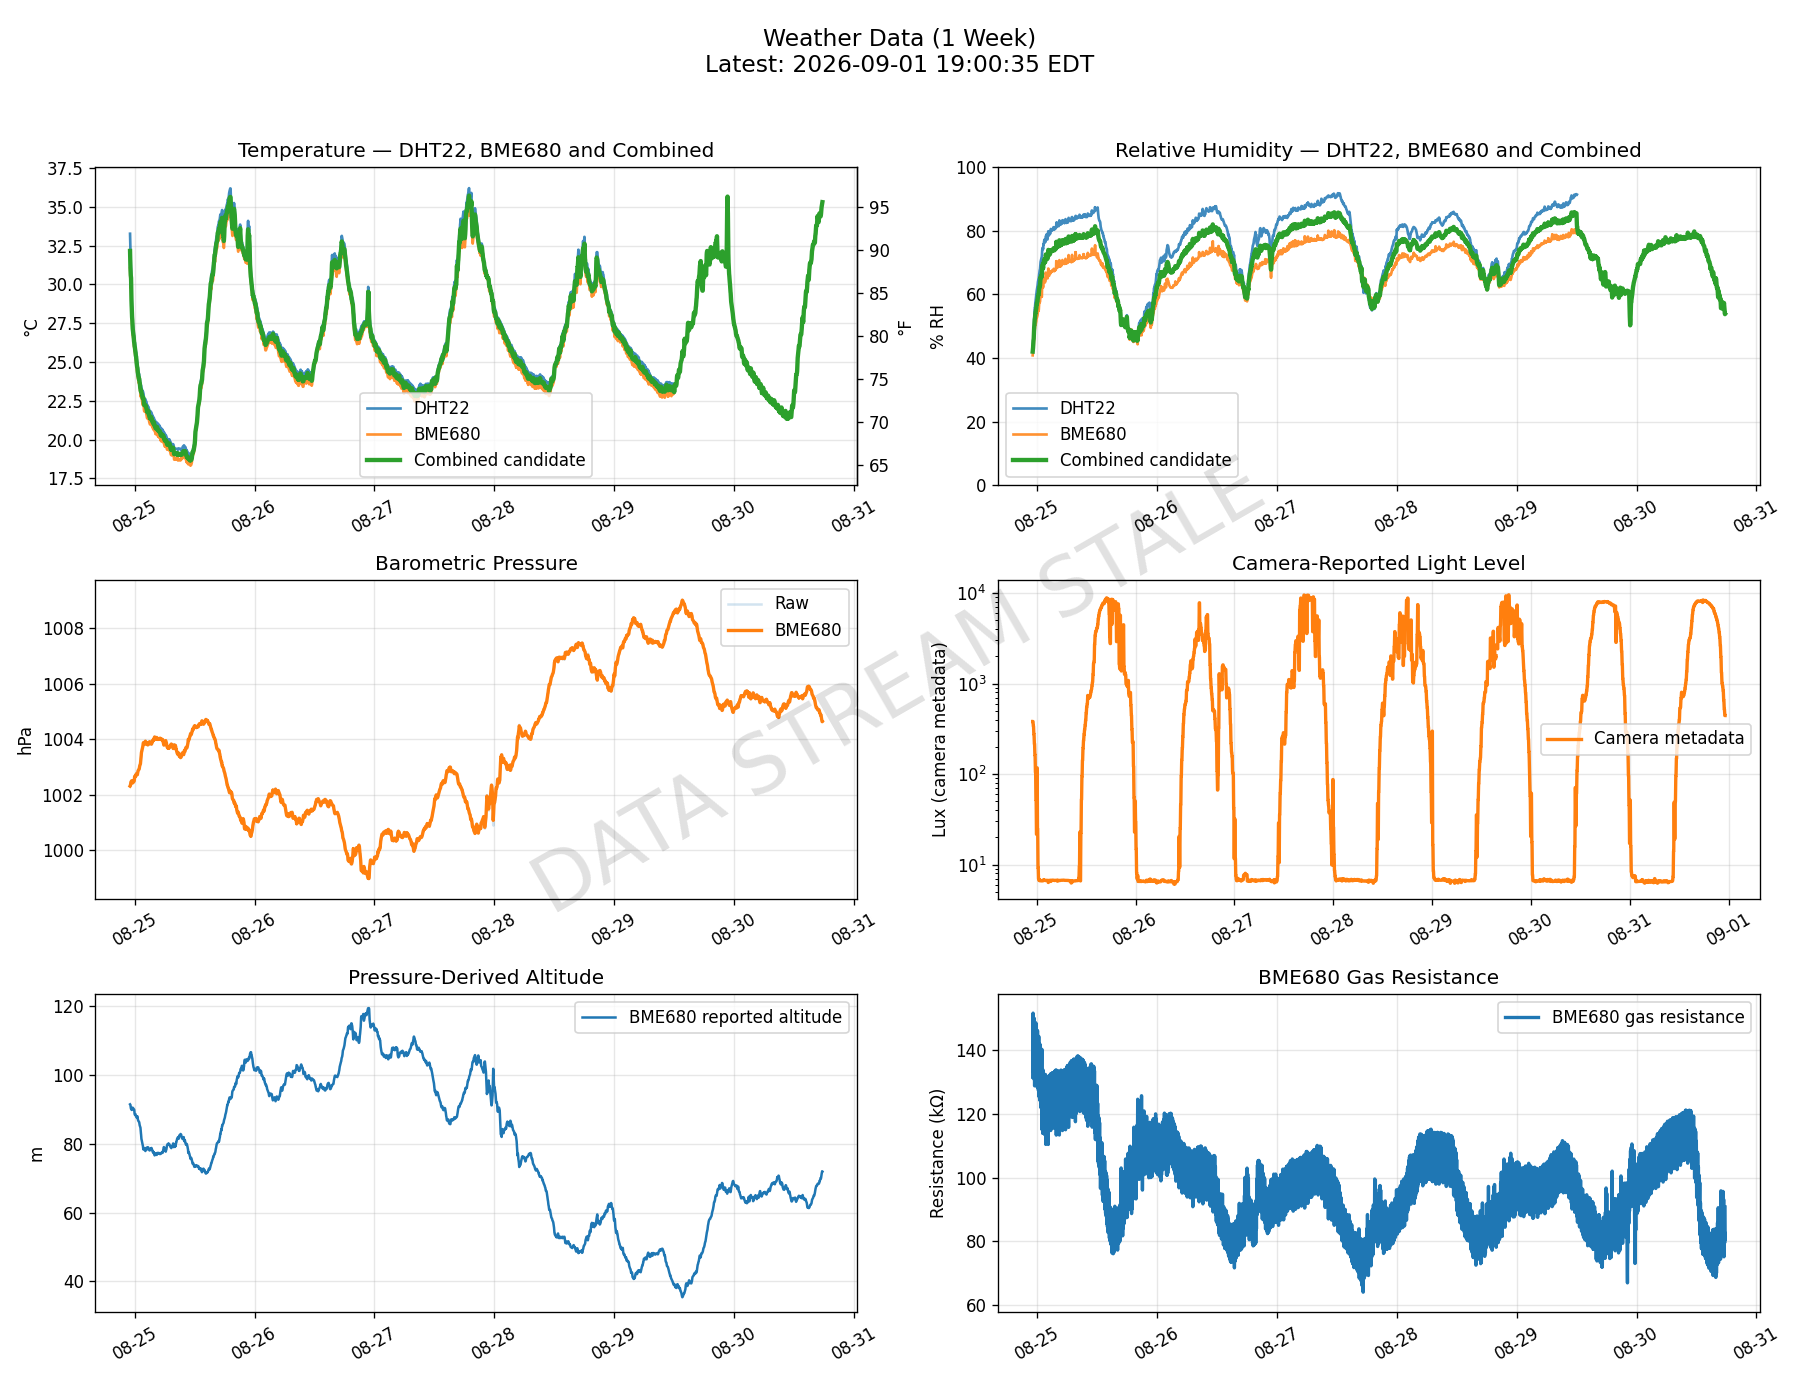
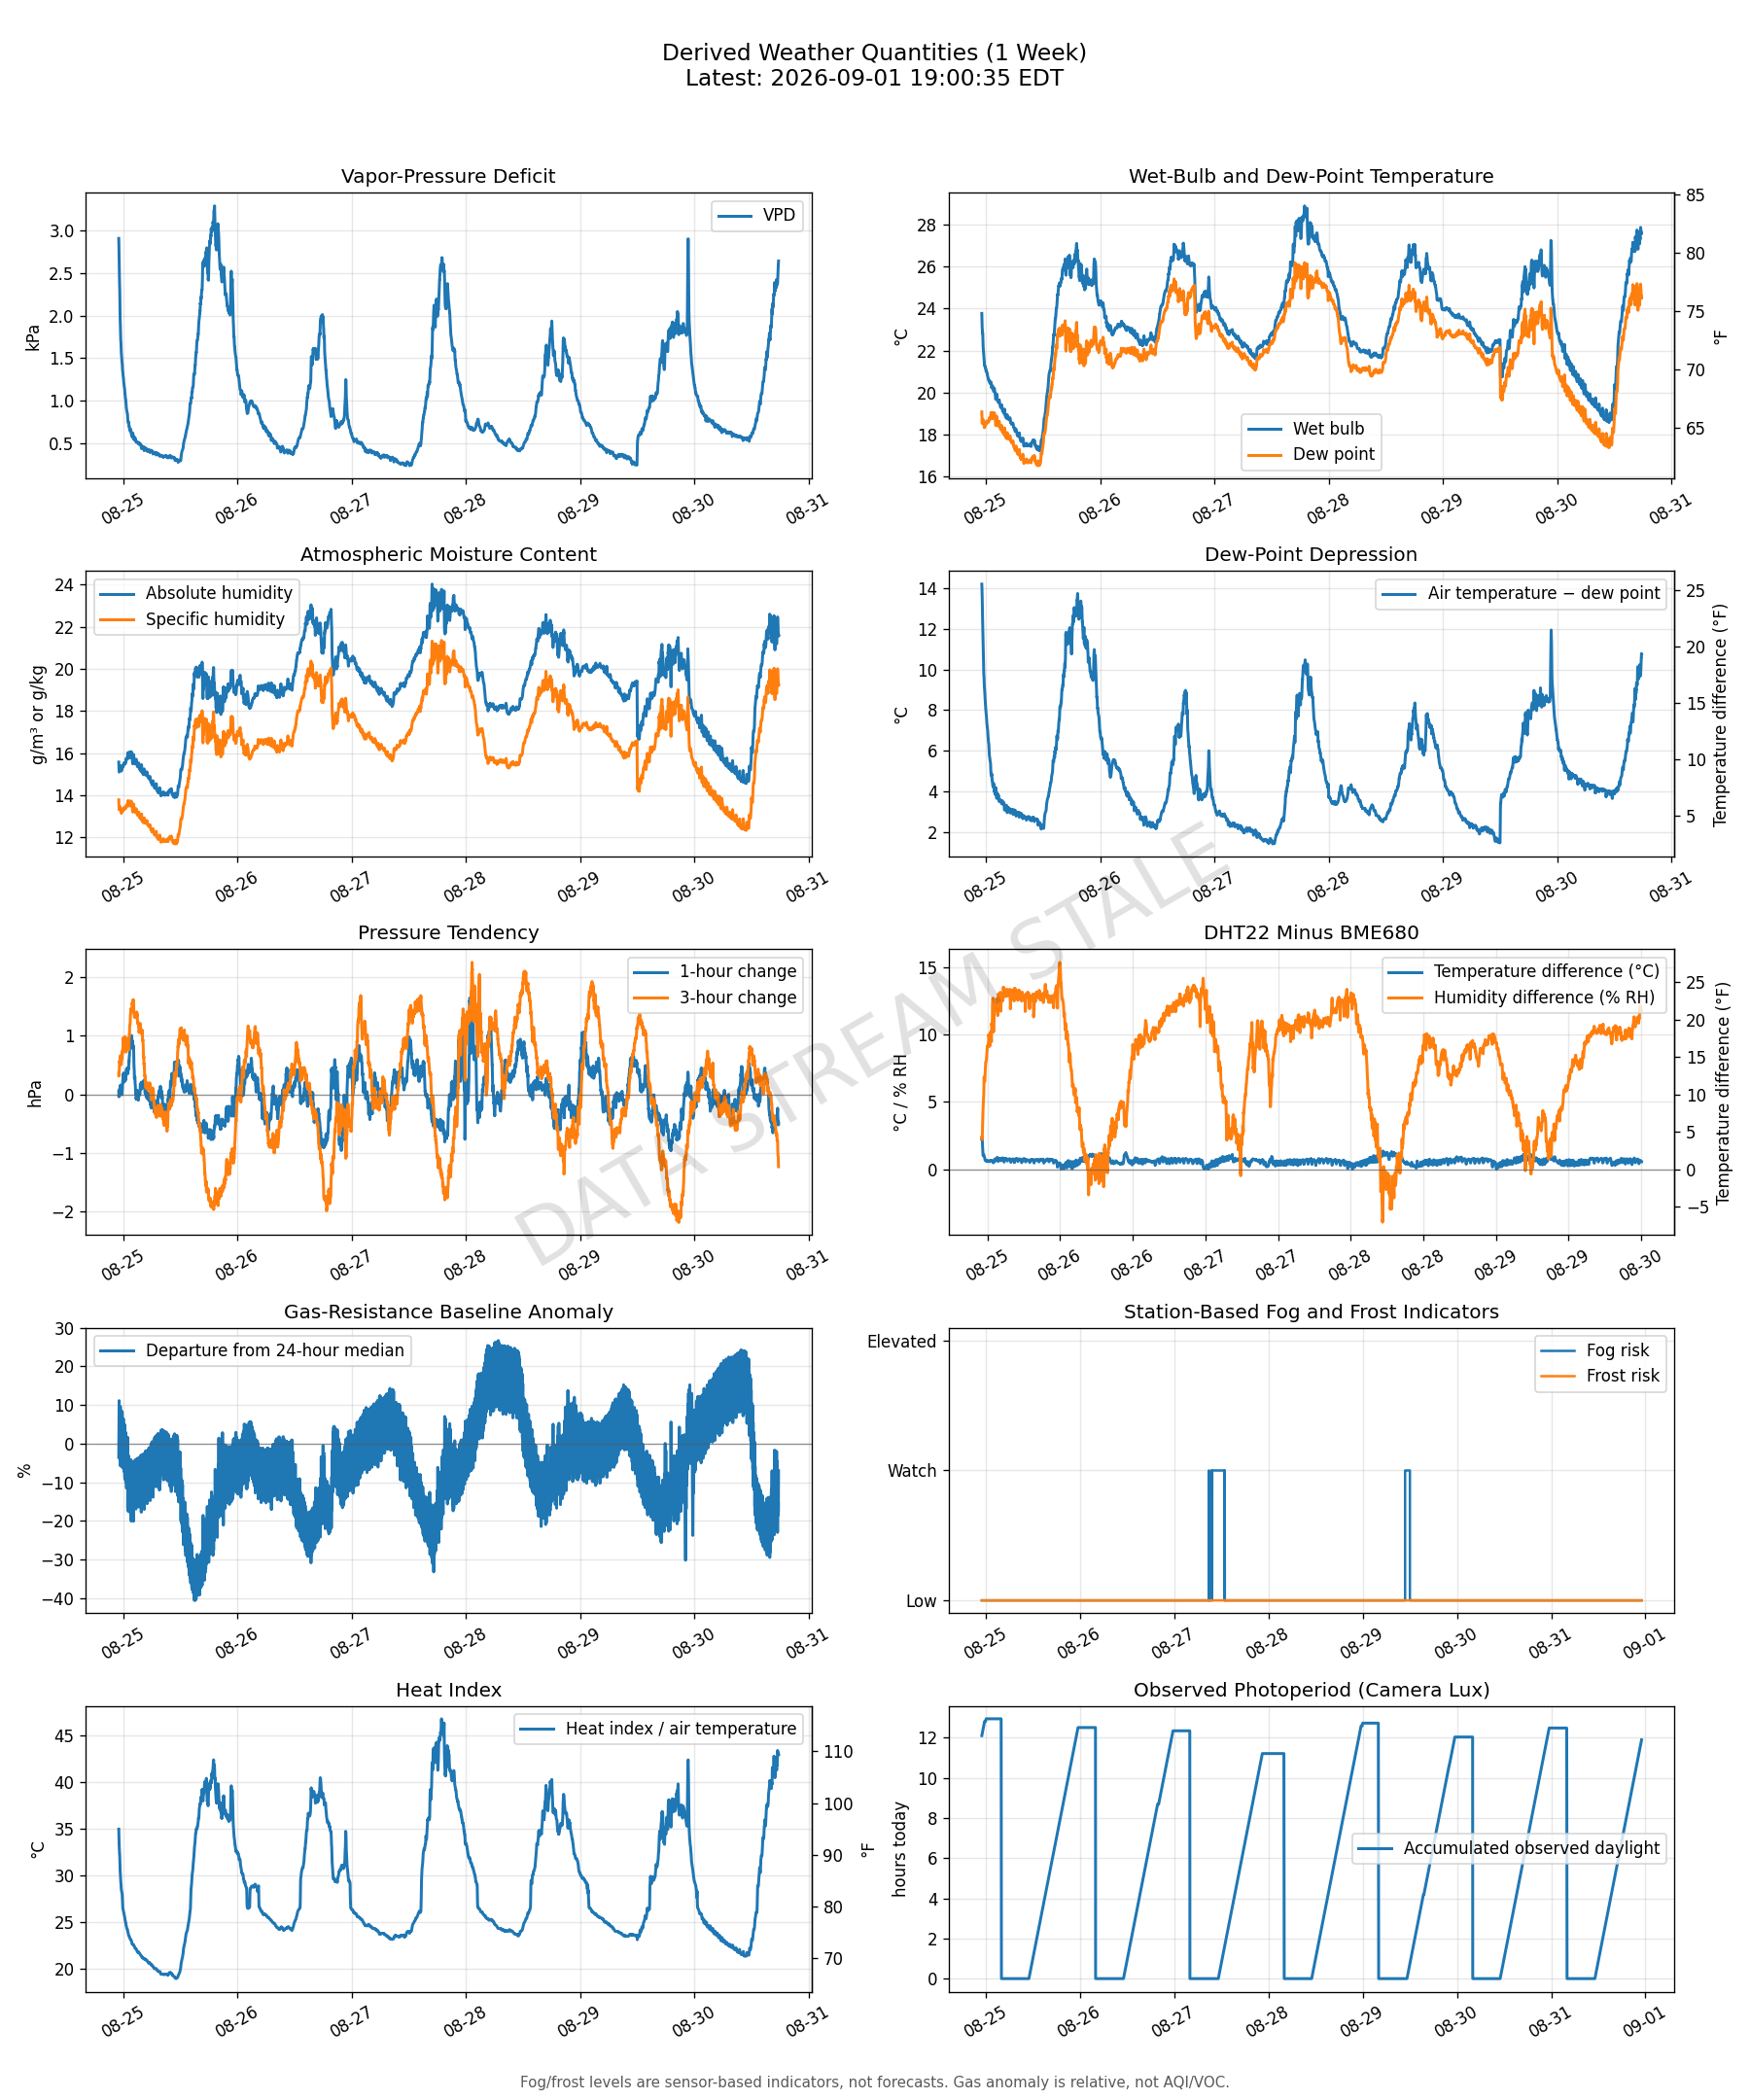
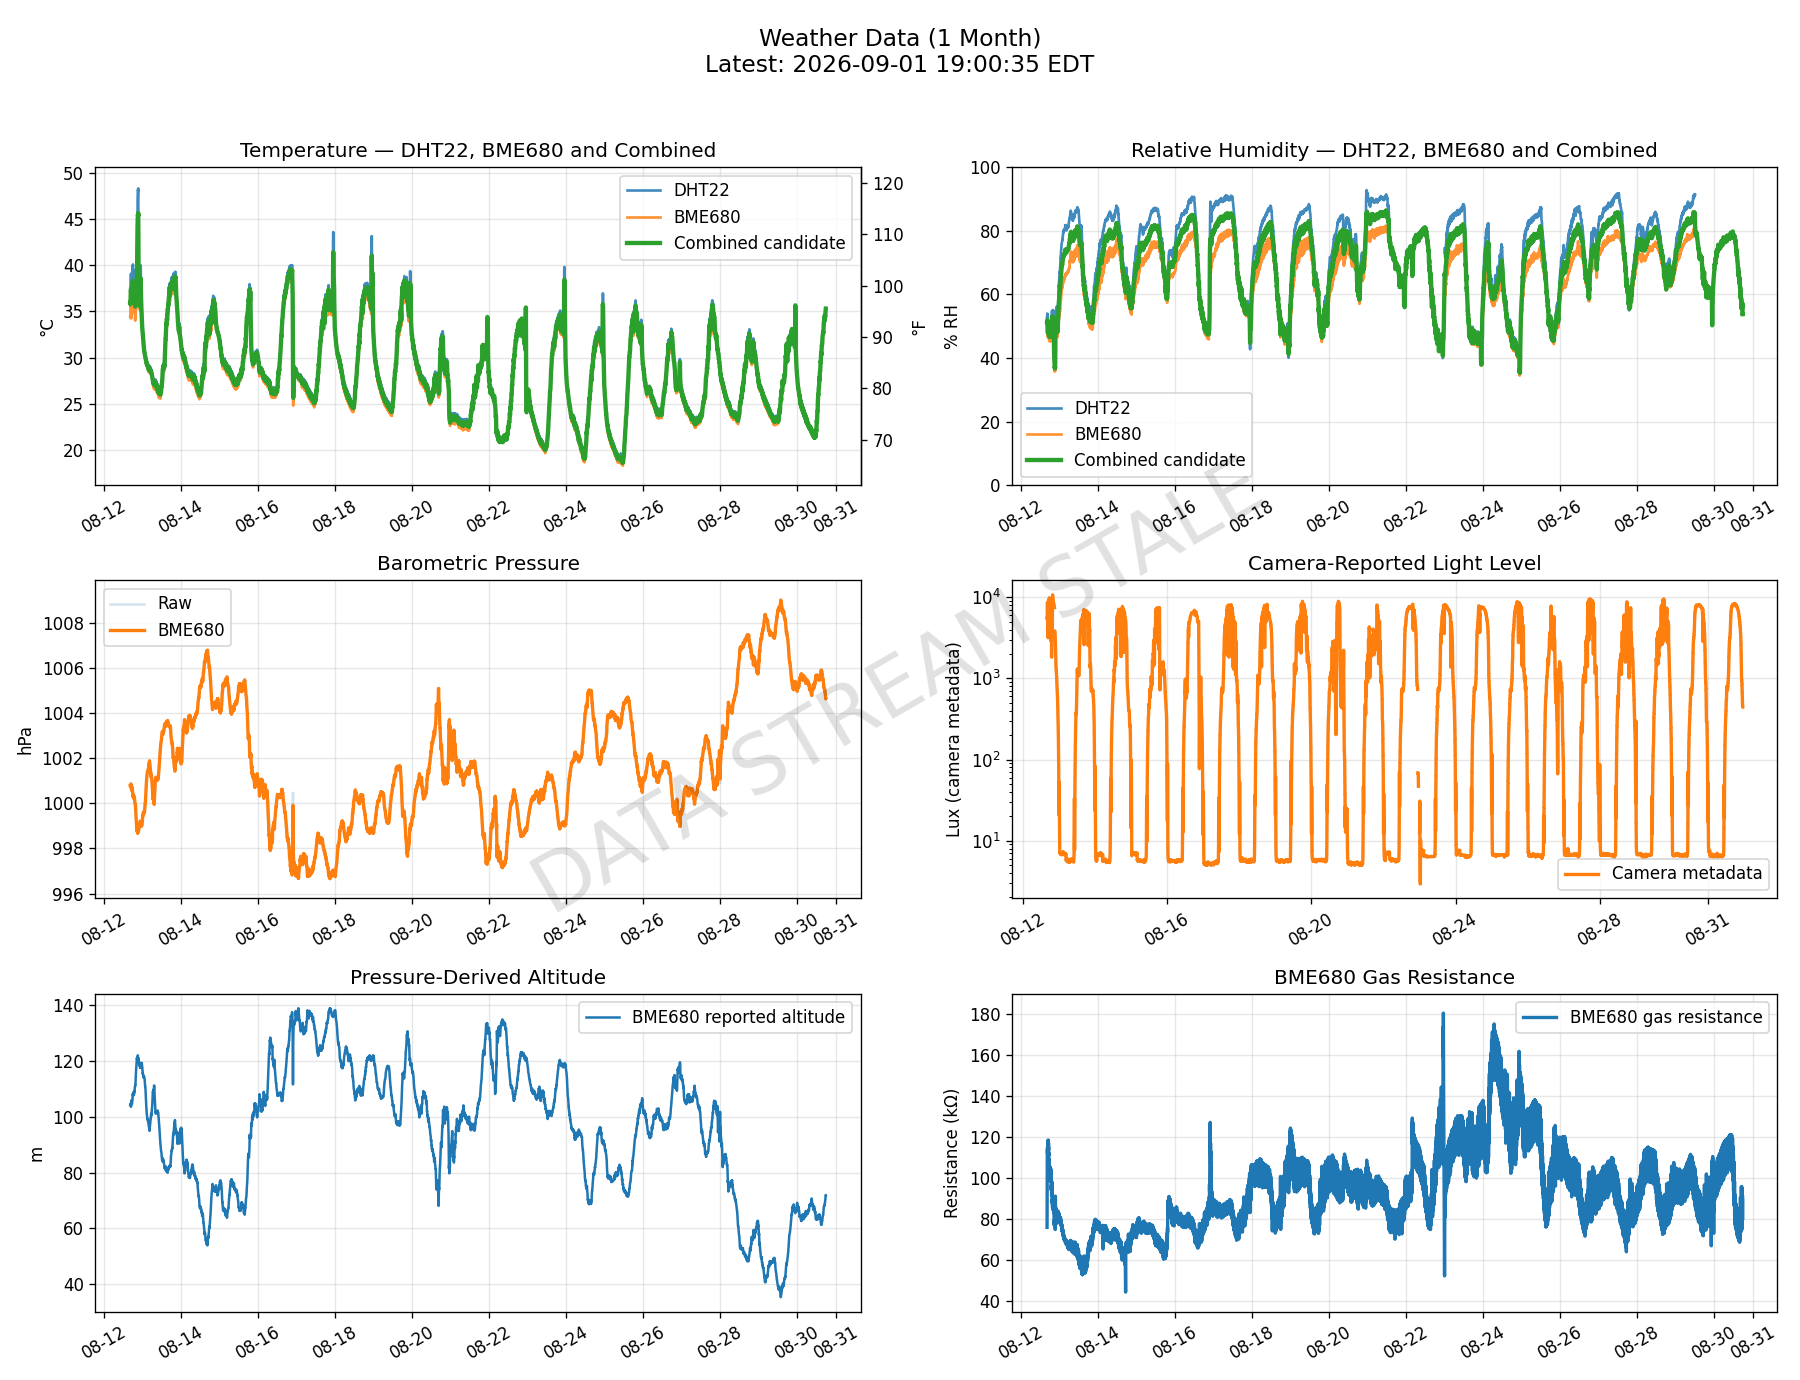
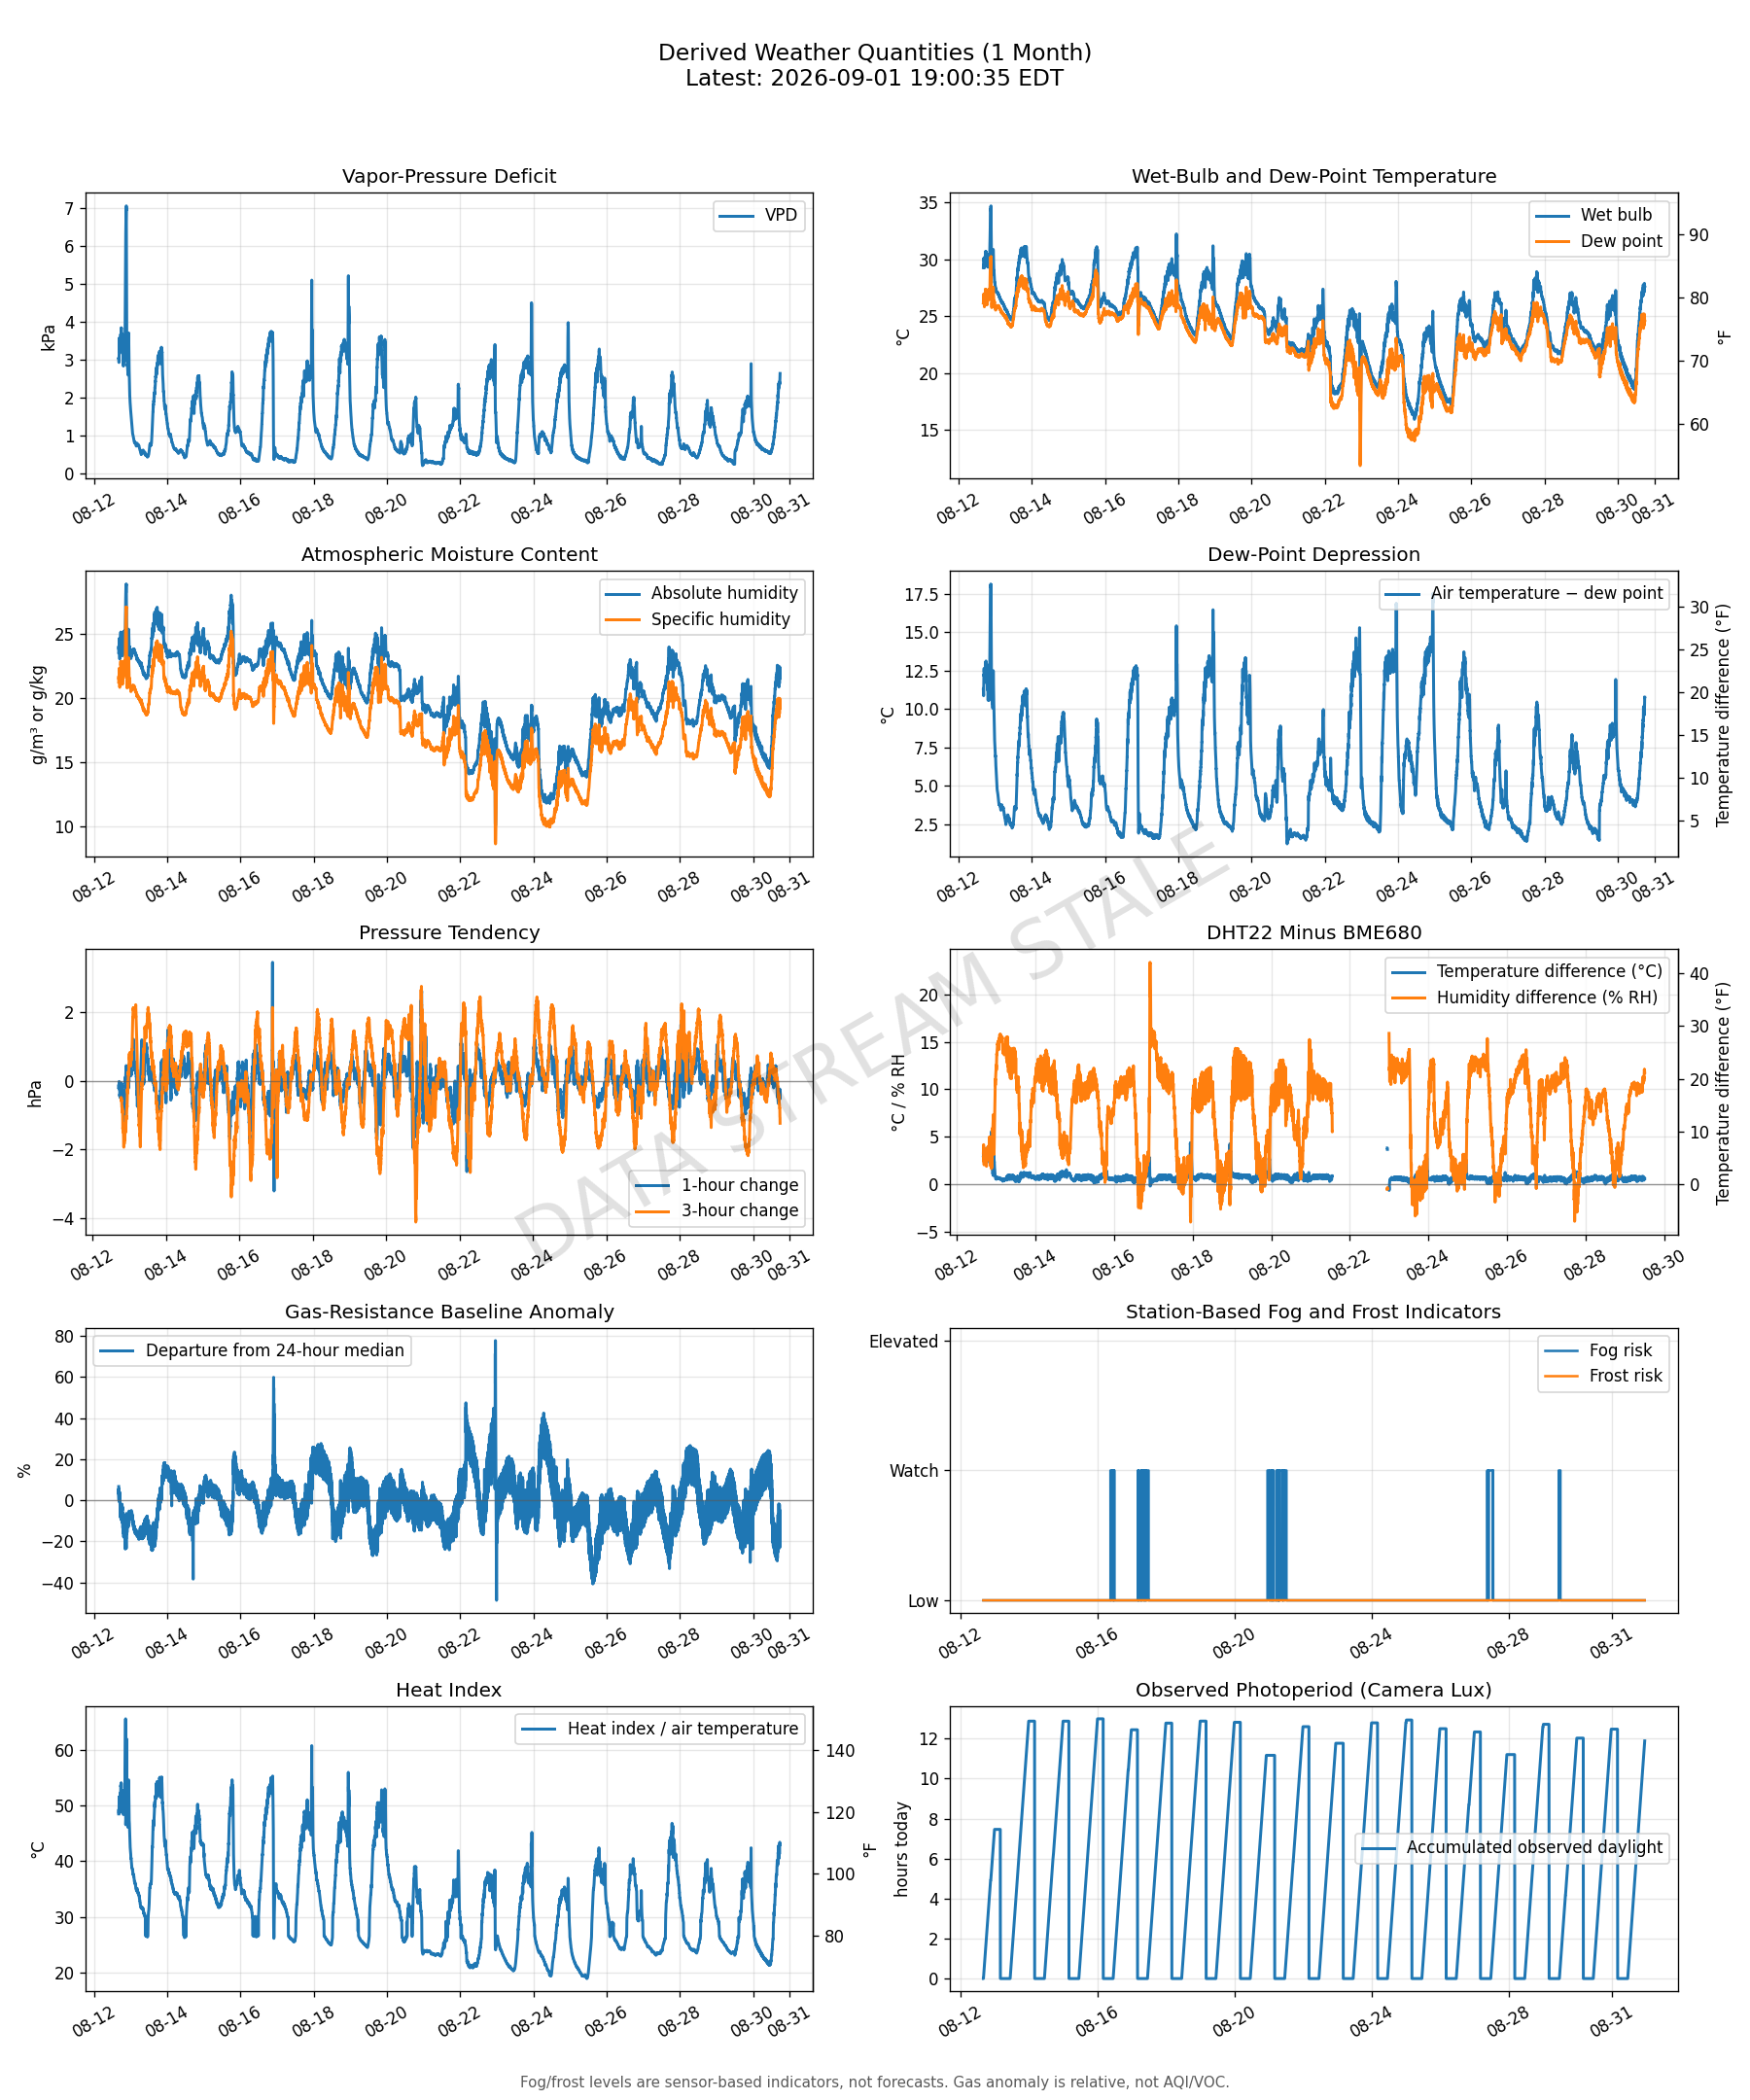
A Raspberry Pi records local conditions with independently monitored sensors. Missing hardware produces gaps in its own trace without stopping the other measurements:
- Auto-discovered DHT22 / AM2302 sensors — Two are currently installed. Individual traces are identified by BCM GPIO, while the headline reading uses their ensemble median.
- BME280 (I²C 0x77) — Measures temperature, relative humidity, and barometric pressure. The displayed altitude is derived from pressure using the configured sea-level reference; it is not directly measured.
- Historical compatibility — Earlier BME680 measurements remain preserved in the downloadable station history.
- Camera (Sony IMX477, 4056×3040) — Replaced the OV5647 on 15 September 2026. Camera-derived lux spans separate hardware/calibration eras across that boundary.
| Direct measurements | Temperature and humidity from each available DHT22; temperature, humidity, and pressure from the BME280 |
| Derived measurement | BME280 altitude from pressure and a 1013.25 hPa sea-level reference |
| Weather data block | Every 30 seconds |
| Data sent to server | Every 5 minutes |
| Forecast model | Temperature and humidity forecasts through five hours, updated from accumulated station data |
Source code: github.com/nialljmiller/weather_station
↓ Download all weather data (.csv)
▶ View all images
▶ View wildlife detections
▶ View training stats
Subscribe to weather updates
Experimental five-minute forecasts are retrained every six hours.
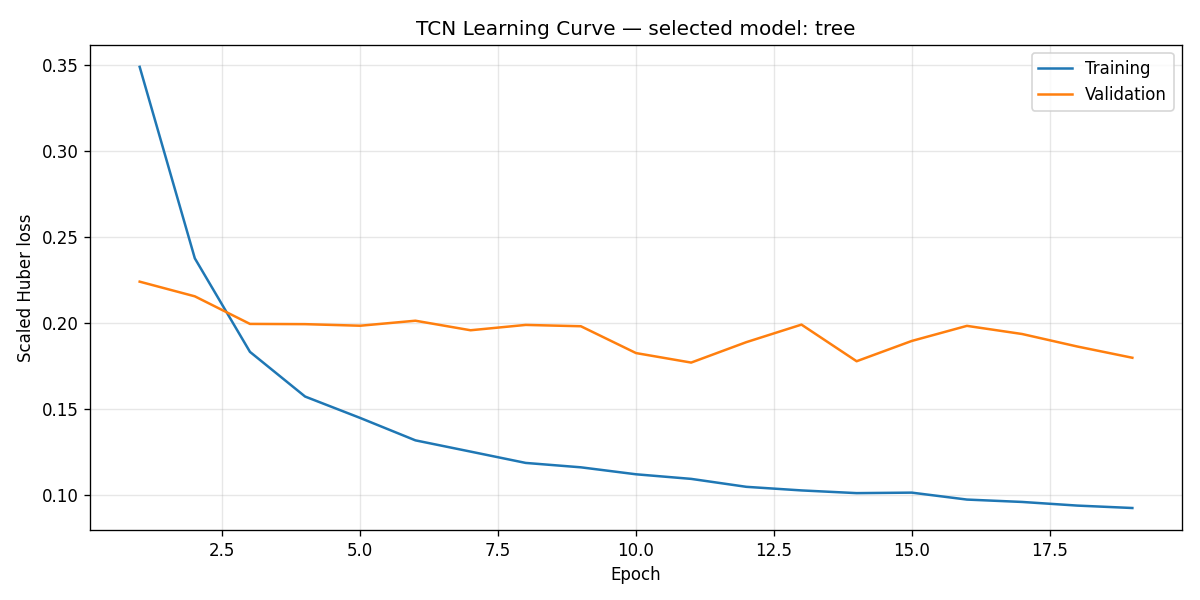
Open all forecast plots, model leaderboard, descriptions, and validation metrics →