Weather Forecast Validation
Models predict temperature and relative humidity directly every five minutes through +5 hours. Training starts with the first complete examples and repeats every six hours. Early scores are experimental and become more representative as the station observes more weather.
Forecast plots
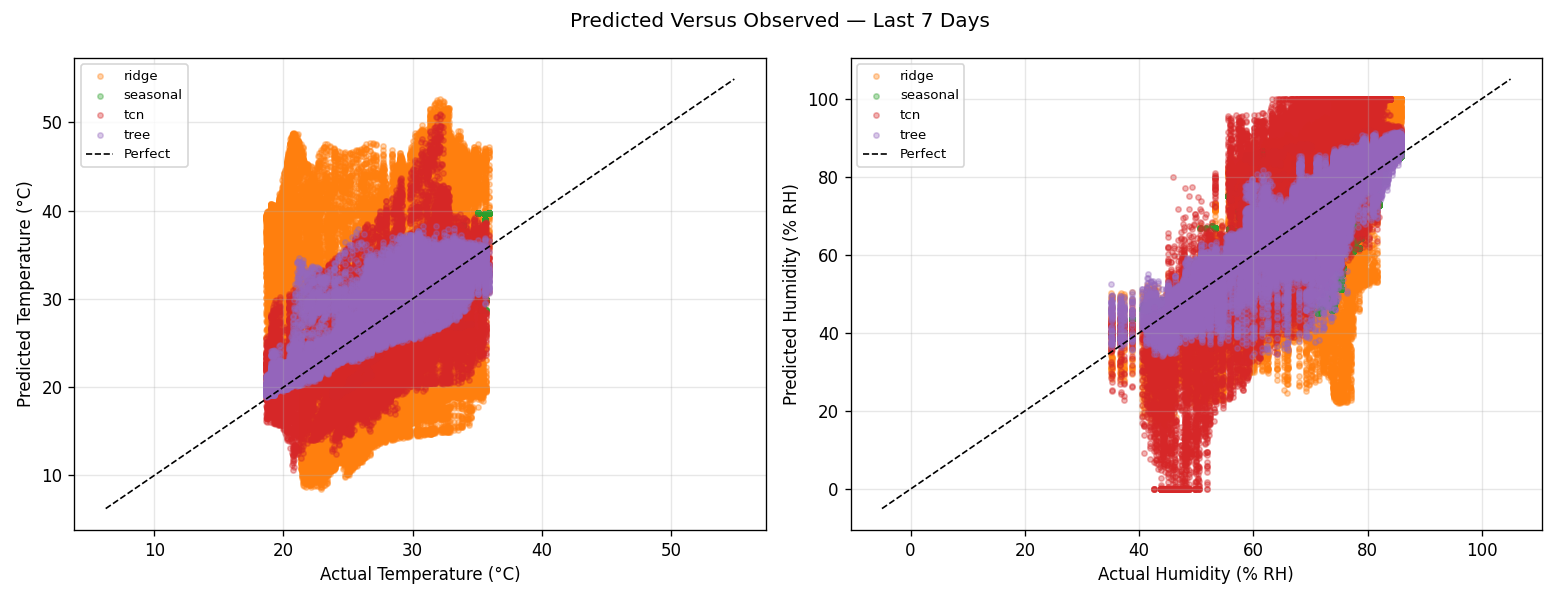
Models in the competition
The same model colors are used in every comparison plot: blue for Persistence, green for Same-time-yesterday, orange for Ridge, purple for Trees, and red for TCN.
| Model | How it works |
|---|---|
| Persistence | This is the simplest possible forecast. The latest measured temperature and humidity are copied unchanged into every five-minute forecast time through five hours. If the station currently reads 20 °C and 60% RH, Persistence predicts 20 °C and 60% RH at every future time. It requires no training and supplies the baseline against which every other model is scored. |
| Same-time-yesterday | This model looks back exactly one day and reuses the observed path from the corresponding clock times. For a forecast issued at noon, its 3:00 PM prediction is yesterday's 3:00 PM observation. It represents the repeating daily heating and cooling cycle without learning fitted parameters. |
| Ridge regression | Ridge fits a separate regularized linear equation for every future temperature and humidity target. Its inputs summarize the recent 12 hours: current sensor readings, changes over several lags, rolling averages, rolling variability, pressure tendency, camera light, gas response, sensor disagreement, derived moisture quantities, and cyclical clock features. The regularization penalty shrinks unstable coefficients when several inputs describe nearly the same physical behavior. |
| Gradient-boosted trees | This model builds a sequence of shallow decision trees for each future target. The first tree makes a rough prediction; each later tree concentrates on correcting the residual errors left by the earlier trees. It receives the same engineered 12-hour summary as Ridge, but can express nonlinear rules and interactions—for example, a temperature trend behaving differently under bright light and falling pressure than under darkness and steady pressure. |
| Temporal convolutional network (TCN) | The TCN is the PyTorch neural model. Instead of receiving only summary statistics, it reads every five-minute feature vector across the complete preceding 12-hour sequence. Dilated one-dimensional convolutions examine patterns at progressively wider time scales. The network then emits all 60 temperature changes and all 60 humidity changes directly in one pass, covering every five-minute point through five hours without feeding its own predictions back into itself. |
How the displayed winner is selected
- The available chronological examples are divided into an earlier training block, a later validation block, and a final test block. Time order is never shuffled across these blocks.
- Ridge, Trees, and TCN are fitted only on the training block. Persistence and Same-time-yesterday require no fitted parameters.
- Every model predicts the validation block. For each target, its MAE is divided by Persistence MAE. These ratios are averaged across all temperature and humidity horizons. The lowest validation score wins provisionally, but a learned model must score below 0.98; otherwise Persistence is retained.
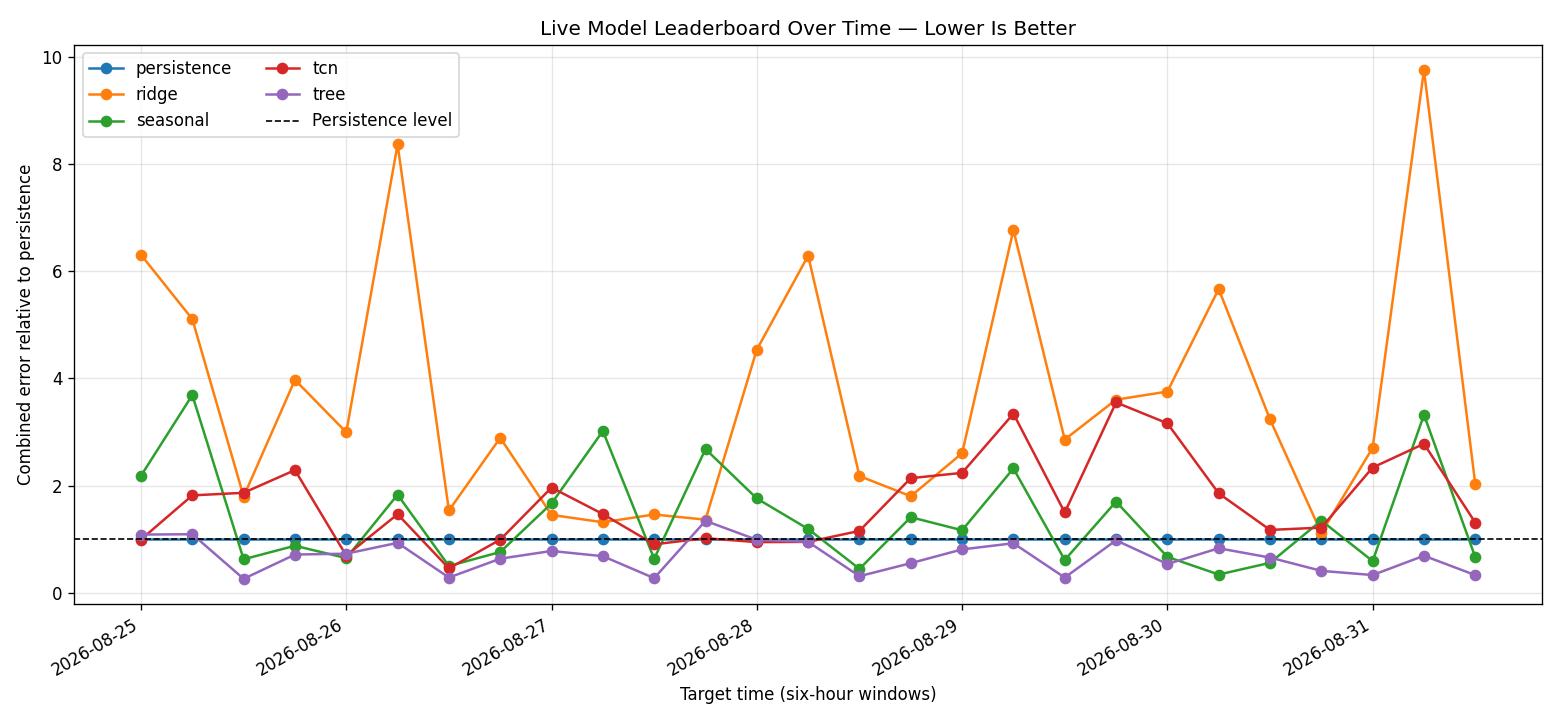
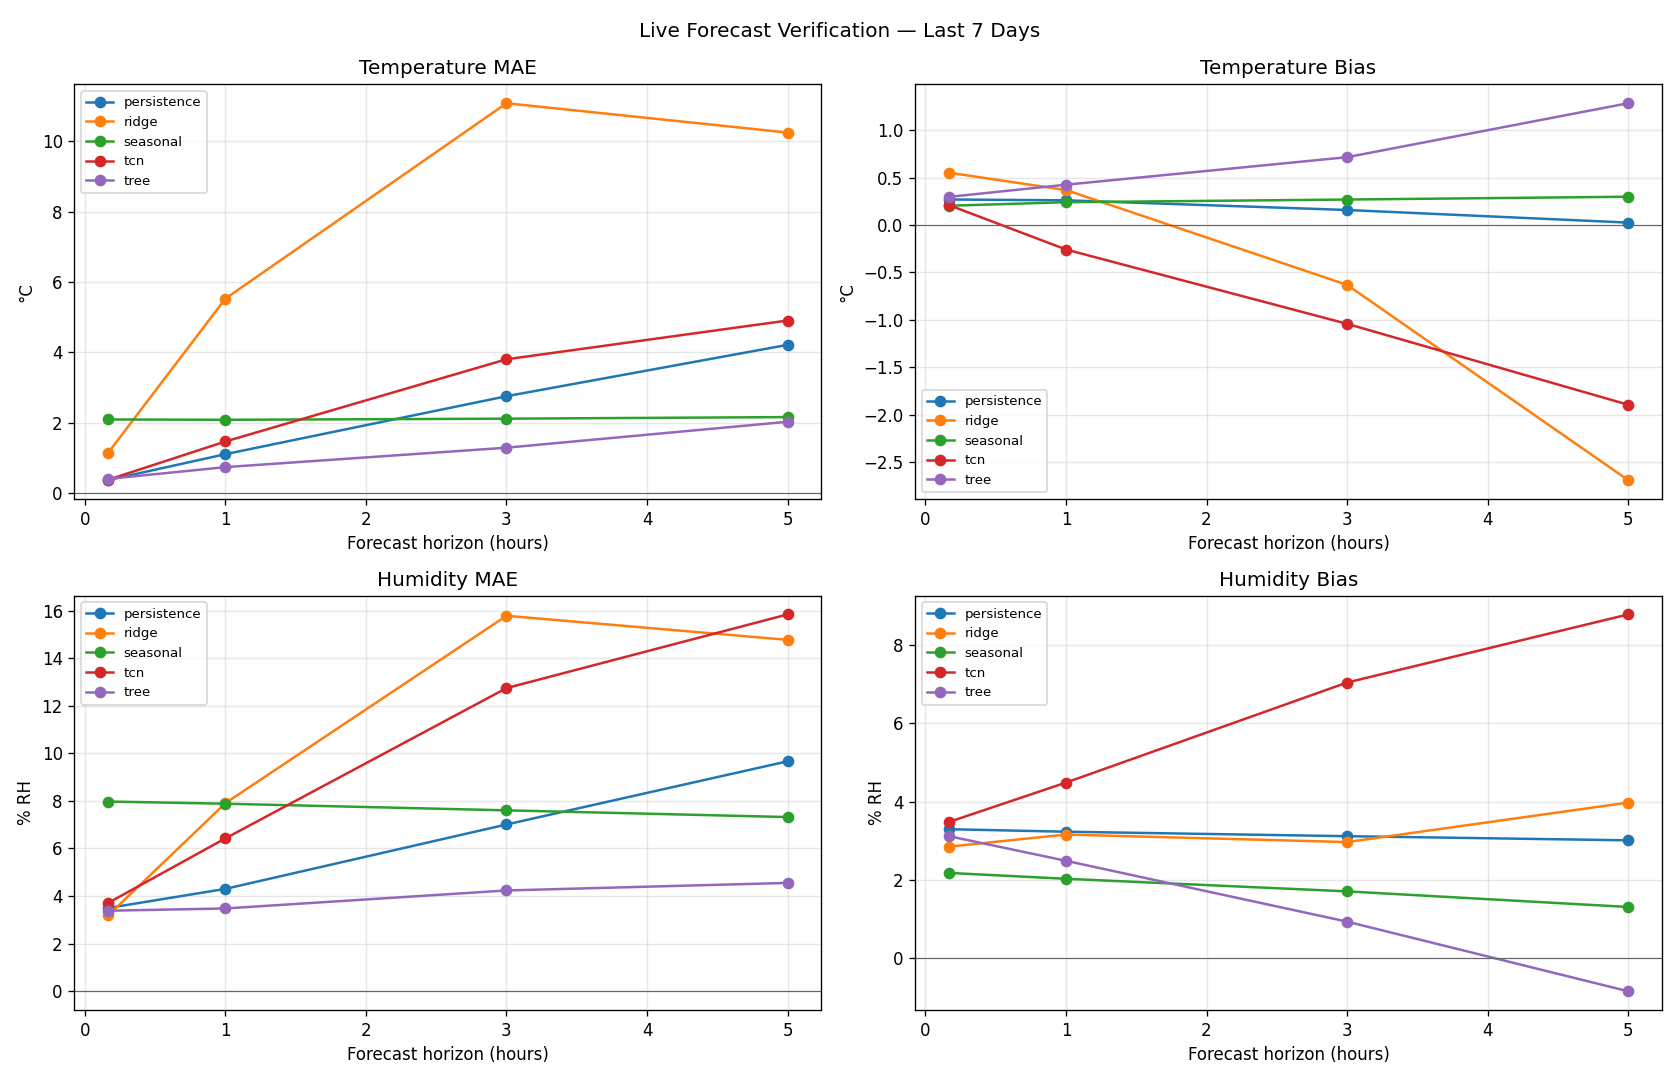
- Every live forecast from every candidate is archived. When its target time passes, the prediction is paired with the actual station observation and becomes a verified forecast.
- After a model has at least 1,200 verified rows in the latest seven-day window—20 complete issues × 60 horizons—temperature skill and humidity skill are calculated against paired Persistence forecasts.
- The live combined score is (temperature skill + humidity skill) / 2. The lowest eligible score becomes the displayed model only when it is below 0.98. If no eligible model clears that threshold, Persistence is displayed.
- The selection is reevaluated as new forecasts mature. Therefore the winner can change as the station encounters new weather and the leaderboard preserves that change over time.
Model comparison
| Model | Validation error relative to persistence |
|---|
Selected-model test performance
| Target | MAE | RMSE | Bias |
|---|
Live forecast verification
| Rank | Model | Verified rows | Temperature skill | Humidity skill | Combined skill |
|---|
Values below 1.0 beat persistence. Live promotion requires at least 1,200 verified rows per model, equivalent to 20 complete five-hour forecast issues.
Download issued forecast ledger · Download verified forecast outcomes
Glossary
Symbols used below: yi is an observed value, ŷi is its prediction, ei = ŷi − yi is prediction error, and n is the number of verified predictions.
| Term | Definition |
|---|---|
| Absolute error | The size of an individual error without regard to direction: |ei| = |ŷi − yi|. |
| Actual / observed value | The temperature or relative humidity that the station actually measured at the forecast target time. It supplies the truth used for verification. |
| Baseline | A deliberately simple reference forecast. Persistence is the primary baseline; Same-time-yesterday is the seasonal baseline. Learned models are useful only when they improve on an appropriate baseline. |
| Batch | A subset of training examples processed together before the neural-network optimizer updates the TCN weights. Batching makes training faster and stabilizes gradient estimates. |
| Bias | The signed mean error: Bias = (1/n) Σ(ŷi − yi). Positive temperature bias means forecasts are too warm on average; negative humidity bias means forecasts are too dry. |
| Bias correction candidate | The recent mean bias calculated separately for a model and horizon. A possible corrected prediction is ŷcorrected = ŷ − Bias. Candidates are reported for evaluation and are not silently applied. |
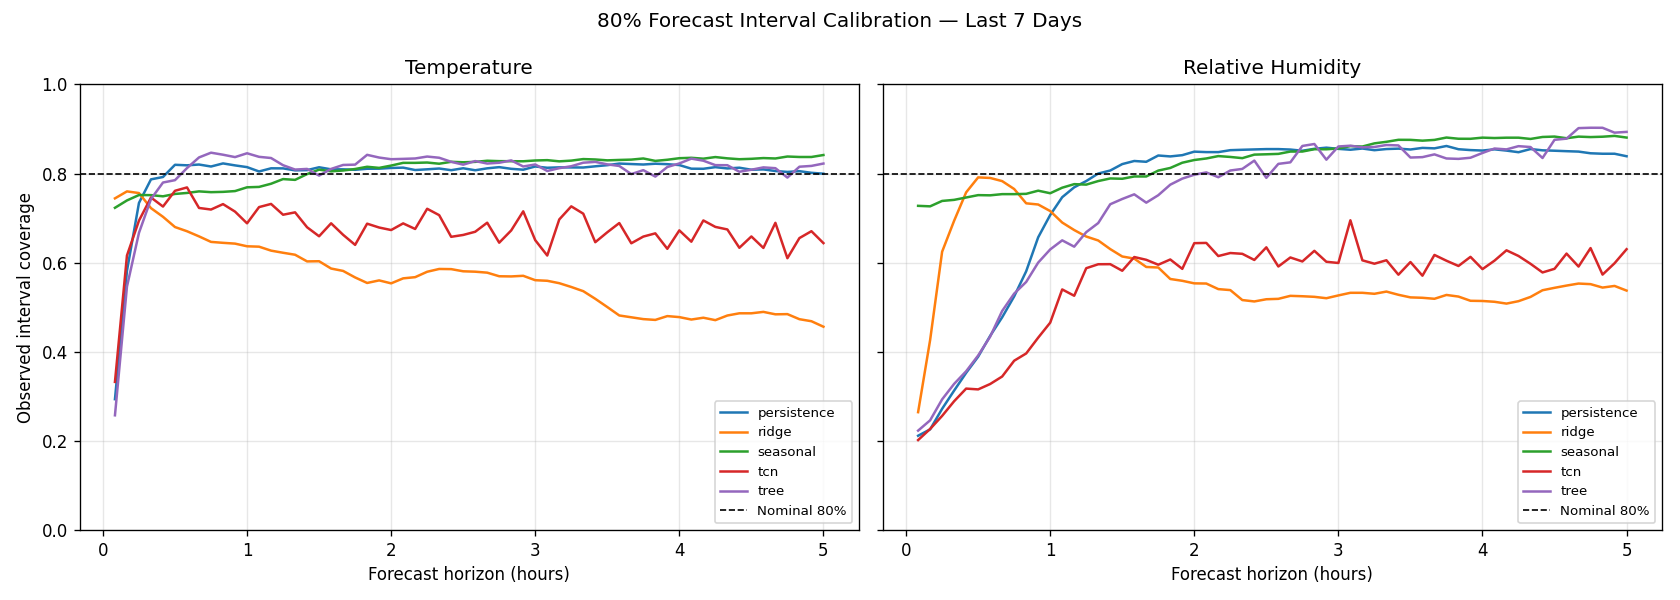
| Calibration | Agreement between stated uncertainty and observed frequency. An 80% interval is well calibrated when approximately 80% of actual outcomes fall inside it over many forecasts. |
| Candidate model | Any model participating in the comparison: Persistence, Same-time-yesterday, Ridge, Gradient-boosted trees, or TCN. Every candidate issues forecasts into the verification ledger. |
| Chronological split | A train/validation/test division that preserves time order. Earlier observations train the models; later observations evaluate them. This prevents a model from learning from the future. |
| Coefficient | A fitted multiplier in a linear model. Ridge predicts from a weighted sum such as ŷ = β0 + β1x1 + … + βpxp. |
| Combined skill | The live leaderboard score used to compare temperature and humidity together: Combined = (Temperature skill + Humidity skill) / 2. Lower is better; 1.0 equals Persistence. |
| Convolution | A learned filter moved across a time sequence to recognize a local pattern wherever it occurs. The TCN uses one-dimensional convolutions because its sequence varies along time. |
| Cyclical clock feature | A sine/cosine encoding of time of day or day of year. For minute-of-day m, the pair is sin(2πm/1440) and cos(2πm/1440). This makes 11:59 PM close to 12:00 AM numerically. |
| Derived feature | A quantity calculated from measurements rather than read directly from a sensor, such as dew point, VPD, pressure tendency, gas anomaly, or sensor disagreement. |
| Decision tree | A sequence of learned if/then splits. Each split sends an example down a branch according to one feature threshold; the terminal leaf supplies a prediction. |
| Dilated convolution | A convolution whose filter samples are spaced apart. Increasing dilation lets the TCN see a wider history without requiring an extremely deep or large network. |
| Direct multi-horizon forecast | A model that predicts every requested future horizon as a separate output in one pass. This station predicts every five minutes through five hours instead of recursively predicting one step and feeding that prediction back as input. |
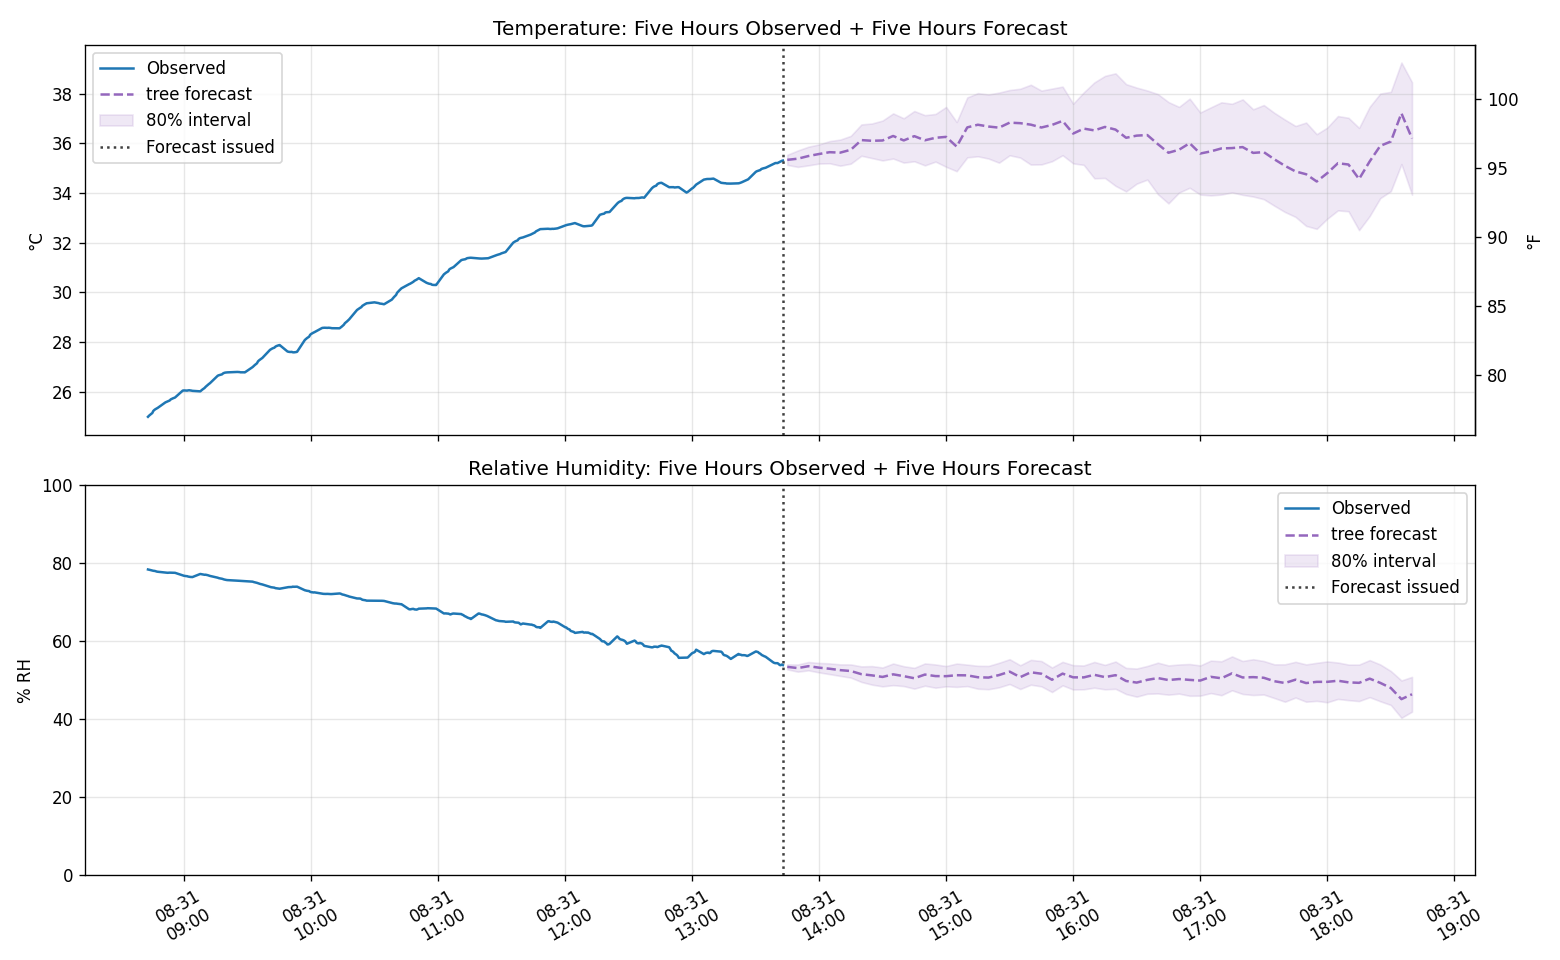
| Displayed / deployed model | The candidate currently used for the public forecast table and forecast curve. Other candidates continue forecasting in the background so they remain comparable. |
| Ensemble | A prediction system formed from multiple component models. Gradient boosting is an ensemble because its final prediction is the sum of many decision-tree contributions. |
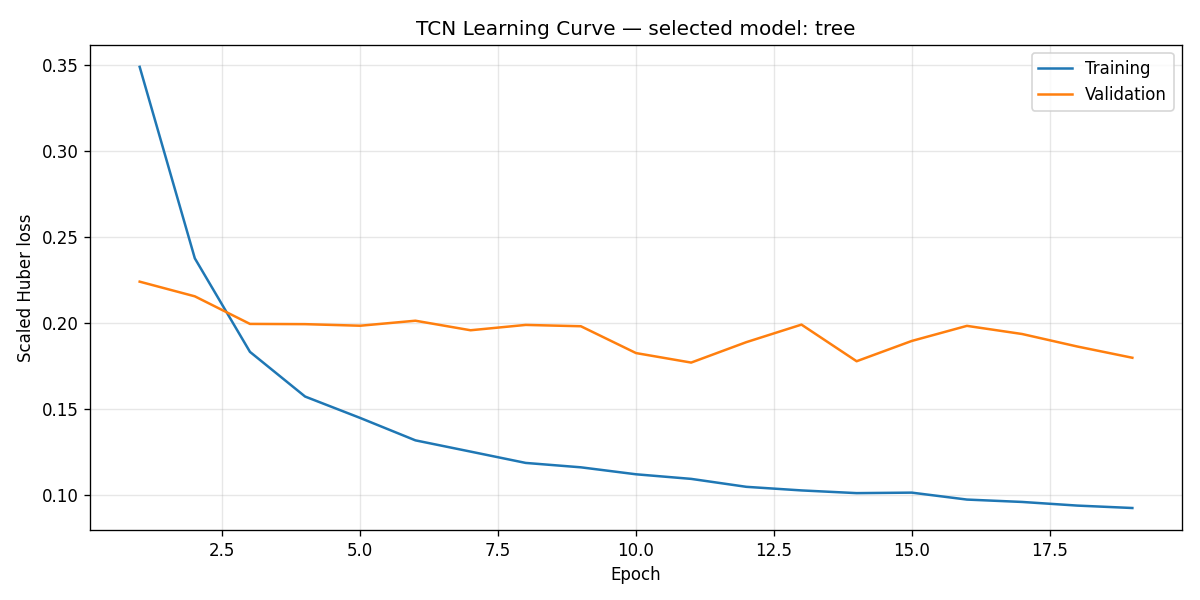
| Epoch | One complete pass through the TCN training examples. The loss plot shows training and validation loss after each epoch. |
| Early stopping | Ending neural-network training when validation loss stops improving for several epochs, then restoring the weights from the best validation epoch. It limits wasted training and overfitting. |
| Error / prediction error | The signed difference between prediction and observation: ei = ŷi − yi. Positive error means the prediction was higher than the observation. |
| Feature | An input supplied to a learned model. Examples include temperature, humidity, pressure, light, recent change, rolling variation, and clock encodings. |
| Forecast horizon | How far into the future a target lies relative to forecast issuance. This system uses 60 horizons: 5, 10, 15, …, 300 minutes. |
| Forecast interval | A lower and upper bound intended to contain the future observation with a stated frequency. The displayed interval is an empirical symmetric 80% interval derived from held-out absolute residuals. |
| Forecast issue time | The timestamp at which a forecast was created using only information available up to that moment. |
| Gas response / gas anomaly | A historical BME680-only measurement and its departure from a rolling baseline. The current BME280 has no gas sensor, so gas is no longer a forecast input and is never synthesized. |
| Gradient boosting | A training procedure that adds trees sequentially, with each new tree fitted to reduce errors remaining from the current ensemble. |
| Gradient-boosted trees | The complete nonlinear tree ensemble produced by gradient boosting. This project fits a separate boosted estimator for every direct temperature and humidity target. |
| Huber loss | A training loss that is quadratic for small residuals and linear for large residuals. For threshold δ: L(e)=½e² when |e|≤δ, otherwise L(e)=δ(|e|−½δ). It is less sensitive to outliers than pure squared error. |
| Humidity skill | Mean humidity absolute error for a candidate divided by mean humidity absolute error for paired Persistence forecasts. Values below 1.0 beat Persistence. |
| Interval coverage | The fraction of verified observations inside their forecast intervals: Coverage = hits / n. The calibration plot compares observed coverage with the nominal 0.80 target. |
| Lag | A past value referenced by its age, such as temperature one hour ago. Lagged differences help models recognize whether conditions are rising, falling, or steady. |
| Leaderboard | A ranking of models by verified predictive error. The time plot uses six-hour target windows; the table uses the latest seven-day live scores. |
| Learning curve | A plot of training and validation loss against epoch. Divergence between the lines can reveal overfitting or a mismatch between training and later data. |
| Loss | The numerical objective minimized during training. Lower loss means the fitted outputs are closer to training targets under that objective; it is not automatically the same as live forecast skill. |
| MAE | Mean absolute error: MAE = (1/n) Σ|ŷi − yi|. It reports the typical error magnitude in the original unit, such as °C or percentage points RH. |
| Model | A rule or fitted mathematical system that maps available measurements and history to future predictions. |
| Model promotion | Changing the displayed model when an eligible candidate has the best live combined skill and scores below 0.98. Until live evidence is sufficient, chronological validation determines the provisional winner. |
| Neural network | A layered function made from learned weights and nonlinear transformations. The TCN is this project's neural network. |
| Nonlinear interaction | An effect that cannot be represented by simply adding fixed input contributions—for example, sunlight having a different temperature effect depending on humidity and time of day. |
| Optimizer | The algorithm that updates neural-network weights from loss gradients. The TCN uses AdamW, which combines adaptive learning rates with weight decay. |
| Overfitting | Learning peculiarities of training data that do not generalize to later weather. A model may show low training loss but worse validation or live error. |
| Overlapping window | A training example whose 12-hour input shares many timestamps with adjacent examples. Overlap creates many examples but not the same amount of independent weather information. |
| Persistence | The baseline forecast ŷ(t+h)=y(t): the future is predicted to equal the latest observation for every horizon h. |
| Pressure tendency | The change in measured barometric pressure over a fixed period, such as P(t) − P(t−3h). It describes direction and rate better than pressure alone. |
| Prediction | A model's numerical estimate of a target before that target is observed. It becomes verifiable only after the target time passes. |
| PyTorch | The software framework used to define, train, save, and run the TCN neural network. |
| Regularization | A penalty discouraging an unnecessarily complex fit. Ridge minimizes prediction loss plus λΣβj², shrinking coefficients toward zero without normally setting them exactly to zero. |
| Relative humidity (RH) | The amount of water vapor present relative to the maximum possible at the same temperature, expressed as a percentage. An error of 5% RH means five percentage points, not 5% of the reading. |
| Residual | The difference left after prediction. In this project it is observation minus prediction when constructing uncertainty intervals: ri = yi − ŷi. |
| Ridge regression | Linear regression with an L2 regularization penalty. “Ridge” refers to the penalty, not a separate kind of input data. |
| RMSE | Root mean squared error: RMSE = √[(1/n) Σ(ŷi − yi)²]. Squaring makes RMSE respond more strongly than MAE to occasional large errors. |
| Rolling statistic | A value repeatedly calculated over the most recent fixed window, such as a 24-hour median or one-hour standard deviation. The window moves forward with time. |
| Same-time-yesterday / seasonal baseline | A forecast using the observation at the target's corresponding clock time one day earlier: ŷ(t+h)=y(t+h−24h). |
| Scaled loss | Loss calculated after inputs and targets have been standardized. It is useful for optimization and comparing epochs, but it is not expressed directly in °C or % RH. |
| Sensor disagreement | The difference between the DHT22 ensemble and the independent secondary environmental sensor: currently BME280, historically BME680. It can expose sensor bias, lag, self-heating, or changing measurement quality. |
| Skill / skill versus Persistence | Candidate MAE divided by MAE from paired Persistence forecasts: Skill = MAEcandidate / MAEpersistence. Here, lower is better: 0.75 means 25% less error, 1.0 ties Persistence, and 1.20 means 20% more error. |
| Standardization | Transforming a variable using its training mean μ and standard deviation σ: z=(x−μ)/σ. This prevents large numerical units from dominating optimization. |
| Target | The future value a model is trained to predict. The learned models predict changes from current temperature and humidity, which are converted back to absolute forecasts for display. |
| TCN | Temporal convolutional network: a neural network built from convolutions along time. “Temporal” indicates ordered time-series input; it is not a separate sensor. |
| Temperature skill | Mean temperature absolute error for a candidate divided by mean temperature absolute error for paired Persistence forecasts. Values below 1.0 beat Persistence. |
| Time series | Measurements indexed in time order. Their order, spacing, trends, cycles, and lags contain information that would be lost if rows were treated as unrelated samples. |
| Test block | The final chronological data block used for an additional held-out performance report and empirical uncertainty estimates after model selection. |
| Training block | The earliest chronological data block used to fit Ridge, Trees, and TCN parameters. |
| Uncertainty | The range of plausible forecast outcomes implied by past held-out errors. It describes observed model error, not all possible future weather and not a guarantee. |
| Validation block | The chronological block after training data used to compare candidates and choose the provisional winner. It is not used to fit Ridge or Trees; the TCN monitors validation loss for early stopping. |
| Validation score | For each of the 120 direct targets, candidate validation MAE is divided by Persistence validation MAE; those ratios are then averaged. Lower is better, and 1.0 equals Persistence. |
| Verified forecast | An archived prediction whose target time has passed and has been matched to a real station observation, allowing its error and interval hit to be calculated. |
| VPD | Vapor-pressure deficit: the difference between saturation vapor pressure and actual vapor pressure. It measures the atmosphere's drying demand and is used as a derived forecast feature. |
| Weight | A learned neural-network parameter controlling how strongly one internal signal affects another. Training adjusts TCN weights to reduce Huber loss. |